


SME Accounting
Financial dashboard for entrepreneurs: Key performance indicators to track in Quebec
July 23, 2026
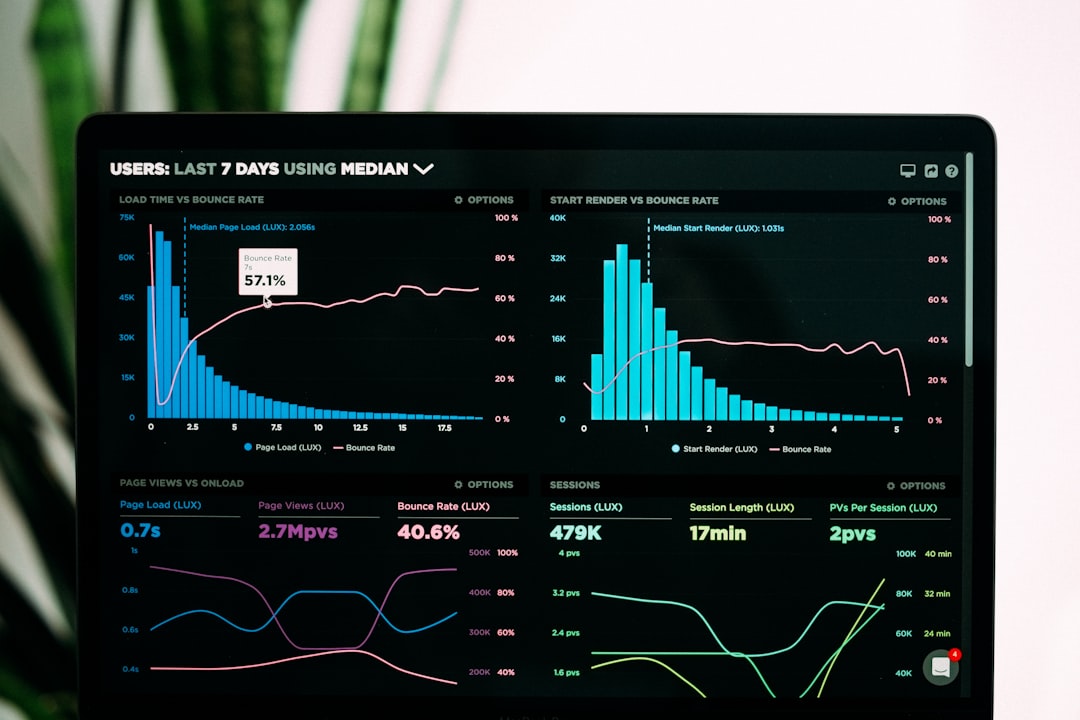
At a Glance. An entrepreneur’s financial dashboard includes 8 to 12 metrics tracked on a fixed schedule: available cash, 13-week cash flow forecast, accounts receivable collection period, gross margin, net margin, EBITDA, plus your GST (5%) and QST (9.975%) balances due and your source deductions (DAS). The most robust model is organized into three levels: weekly for cash flow, monthly for profitability, and quarterly for tax purposes. Your accountant can set it up in about three months, as part of a retainer whose median cost is around $3,000 per year, according to the Bankeo Fee Barometer.
Many Quebec entrepreneurs manage their businesses using two tools: their bank account balance and annual financial statements. The former changes too quickly to provide any meaningful insight, while the latter arrives months after the decisions it was meant to inform. In between, there’s the financial dashboard: one page, about ten metrics, a routine for reviewing it. This guide offers a practical template for Quebec: which KPIs to track, how often, with what alert thresholds, and how your accountant can set it up. It builds on our article about the Essential Financial Ratios for an SME, which details the formulas and benchmark values for each ratio.
These two documents don’t answer the same question. Financial statements tell you what happened; the dashboard tells you what’s happening now and what’s coming up.
Cash flow is the only factor that can bring a profitable business to a halt. That’s why it’s the top section of the dashboard, and the only one you should review every week.
The 5% GST and 9.975% QST you charge are amounts you hold in trust for the CRA and Revenu Québec, just like source deductions on each paycheck. The best practice: Set these amounts aside in a dedicated bank account as you receive payments. Your tax balance due then becomes just another KPI, and each payment is made without any surprises.
Once cash flow is under control, the dashboard answers the second question: Is the business actually making money, and from what?
The exact formulas and benchmark values for these ratios are detailed in our guide to Essential Financial Ratios for an SME. A prerequisite: up-to-date bookkeeping, with monthly bank reconciliations. Metrics calculated based on outdated records result in pretty graphs and poor decisions; our article on the Monthly Cost of Bookkeeping in Quebec Quantify this requirement.
The third section of the dashboard tracks obligations to the CRA and Revenu Québec. These amounts are known in advance: if monitored closely, they never create an emergency.
Here is the dashboard template that an accountant typically sets up for a Quebec-based SME. The alert thresholds are starting points: your accountant will adjust them based on your industry and seasonal trends.
| Key Performance Indicator (KPI) | Formula or source | Frequency | Current Alert Threshold |
|---|---|---|---|
| Available Cash | Consolidated Bank Balances | Weekly | Less than 4 weeks’ worth of fixed expenses in reserve |
| 13-Week Cash Flow Forecast | Projected cash inflows minus projected cash outflows, week by week | Weekly | A projected negative balance, even for just one week |
| Days Sales Outstanding (DSO) | Accounts receivable ÷ annual sales × 365 | Monthly | More than 45 days, or an increase for two consecutive months |
| Gross Margin | (Revenue minus cost of goods sold) ÷ revenue | Monthly | Down more than 2 points below the 12-month average |
| Net Margin | Net Income ÷ Revenue | Monthly | Based on your industry |
| EBITDA | Earnings Before Interest, Taxes, and Depreciation | Monthly | Negative for Two Consecutive Months |
| Working Capital Ratio | Current Assets ÷ Current Liabilities | Quarterly | Under 1.2 |
| GST/QST Balance Due | Taxes Collected, Less ITC and ITR | Monthly | Unallocated balance in a dedicated account |
| Source Deductions to Be Filed | Deductions and Contributions from Each Paycheck | With Every Pay Period | Any late filing with the CRA or Revenu Québec |
| Tax Instalments | Notice of Assessment and Reminders from the CRA and Revenu Québec | Quarterly | Payments Due in Less Than 30 Days Without a Reserve |
The dashboard is monitored on an exception basis: as long as an indicator remains within its target range, you move on to the next one. Reaching a threshold triggers a specific, predefined action (following up on accounts receivable, adjusting a price, contacting the accountant). This is what distinguishes a dashboard from a simple report.
Implementation follows a proven process, typically spanning three months.
Role-wise: The bookkeeper produces raw data, and the accountant transforms it into metrics and provides analysis. A CPA who is a member of the Ordre des CPA du Québec can go a step further when the need arises: financial forecasts, financial statements for the bank, and tax planning. You can also browse the Vetted accountants in the Bankeo network to compare profiles and areas of expertise.
When it comes to budgeting, this monitoring is part of an ongoing accounting engagement. The median cost is around $3,000 per year, and most businesses pay between $500 and $6,000 depending on the industry and the scope of the engagement, based on actual fees from 1,248 engagements secured through Bankeo (2024-2026), out of more than 15,000 requests received. The Bankeo Fee Barometer provides a breakdown of these ranges by department.
Bankeo connects you for free with vetted accountants from its network of over 1,500 partners, who will set up your bookkeeping, KPIs, and monthly routine. The service is free, with an initial matching process often completed within 48 hours, no commitment required, and we’ll support you for as long as you need.
Find my accountantStart with cash flow: available cash, a 13-week forecast, and accounts receivable collection period. Next, add three profitability metrics (gross margin, net margin, EBITDA), followed by your tax obligations: GST and QST balances due, source deductions, and tax instalments. A set of 8 to 12 metrics, reviewed at regular intervals, covers the essentials for a Quebec SME.
Three reporting cycles work well: weekly for cash flow (cash on hand, forecasts, accounts receivable), monthly for profitability (margins, EBITDA, break-even point), and quarterly for tax purposes (GST/QST, tax instalments), along with a meeting with your accountant. Consistency matters more than sophistication: a simple dashboard reviewed on a set schedule is better than a detailed report that no one ever opens.
Financial statements summarize a completed fiscal year: they are prepared after the end of the year and are used for tax returns (T2 and CO-17 for a corporation, T1 and TP1 for a self-employed individual), for the bank, and for shareholders. The dashboard, on the other hand, looks ahead: it’s updated weekly or monthly and is used to make decisions (such as hiring, adjusting prices, or following up on accounts receivable). The two complement each other; they are not interchangeable.
Yes. The 5% GST and 9.975% QST that you collect, just like payroll source deductions, are amounts you hold in trust for the CRA and Revenu Québec. Tracking them as KPIs in their own right, and setting aside funds in a dedicated account, ensures these amounts are available when it’s time to remit them and makes each due date predictable.
Yes, this is a common service: it starts by ensuring your bookkeeping is accurate, works with you to select 8 to 12 metrics tailored to your business model, sets alert thresholds, and then produces a monthly report with commentary. A CPA who is a member of the Ordre des CPA du Québec can take it a step further with forecasts or financial statements. Bankeo connects you for free with a vetted accountant who offers this type of service.
Tracking KPIs is generally part of a recurring accounting mandate (bookkeeping, reporting, tax matters). The median cost is around $3,000 per year, and most businesses pay between $500 and $6,000, based on actual fees from 1,248 engagements secured through Bankeo (2024-2026), out of more than 15,000 requests received. The Bankeo Fee Barometer provides a breakdown of these ranges by department and by sector.
General information provided for informational purposes only, based on known 2026 tax rules. It is not a substitute for the advice of a Chartered Professional Accountant (CPA): always consult a professional regarding your specific situation.
The Bankeo matching service is 100% free, always. You only pay your accountant directly.
We’ll connect you with the right accountant from our network to meet your needs, we have as many profiles as you need.
We’ll support you for as long as it takes. We’re here for you every step of the way.
Your request will be processed within 2 business days.